
Mind Over Markets CHAPTER 2 - Novice
Novice is the first stage in any process. No one starts out an expert, or even an advanced beginner. To learn any skill, you must begin by learning the necessary objective facts and features—the tools with which you will build your skill from the ground up. Just as a carpenter learns the function of a saw, hammer, and plane before attempting to make his first basic bird feeder, you must learn the mechanics of the Market Profile before you make your first basic market decisions.
The learning that occurs during the novice stage is largely rote memorization. The carpenter is taught the workings of his tools; the aspiring pianist is taught the definitions that form the base of all music theory. This learning comes from a derivative source, such as a book or a teacher, and does not involve the novice in any active way as he or she sits and listens or reads. Some degree of derivative learning is necessary, especially during the early stages, but in the words of the ancient Greek philosopher Heraclitus, “Much learning does not teach understanding.” Only through experience and extensive practice and application will understanding and expertise arise.
Throughout this book (a derivative source), there are many definitions and patterns to memorize. It is important to remember, however, that the information is only part of a larger whole that will develop as you read and attempt to assimilate what you have learned with your personality, individual trading style, and experience. Keep an open mind and actively apply the new knowledge to your observations of the marketplace.
Perhaps some of your established beliefs have already been thrown into question. In the example at the beginning of the book, Jim the yen trader is torn between the different sources of information: fundamental, technical, and market generated. All the fundamental sources (newspapers, trade magazines, personal advice) and technical sources (channel models, moving averages, etc.) were predicting a rally in the foreign currencies. The marketgenerated information, which is the market’s price activity recorded in relation to time in a study with statistical curve, was indicating a market that had reached the top of the up movement. This is not to say that all technical gurus, financial writers, and market analysts are useless—there is just no greater indication of what the market is doing than the market itself!
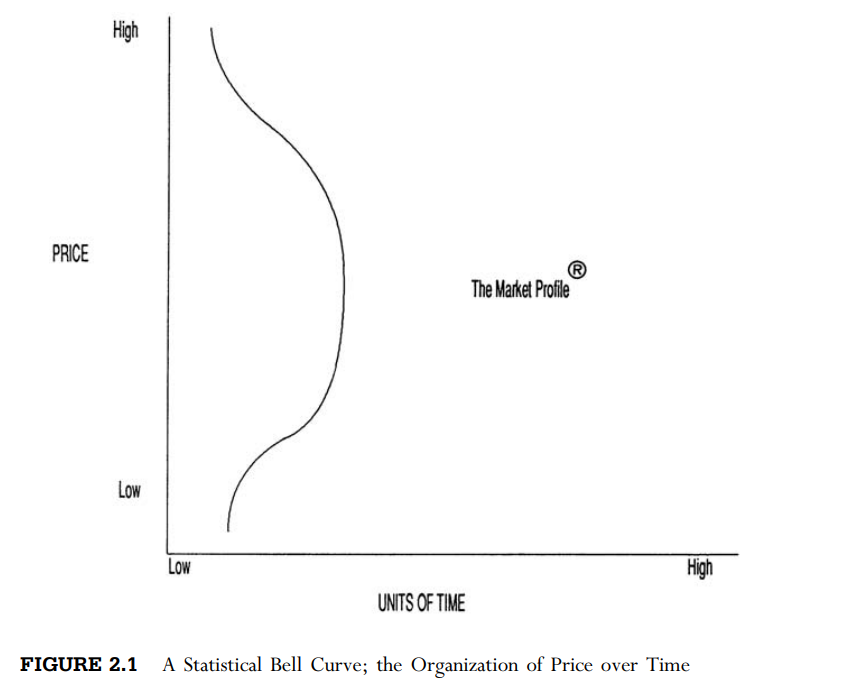
The Market Profile is a conduit for listening to the market. It is merely a graph that plots time on one axis and price on the other to give a visual impression of market activity. This representation takes the form of a statistical bell curve, just like your high school teacher used. Most students scored in the middle of the bell curve with Cs, while fewer received As and Fs. Similarly, the majority of a day’s transactional volume takes place in a common range of prices, with less trading on the day’s extremes (see Figure 2.1).
The Market Profile is simply a way of organising market activity as it unfolds. It is not a system that predicts tops and bottoms or trend continuation any more than the teacher’s grade chart is an indicator of overall student intelligence.
The Market Profile is an evolving gauge that accurately reflects market activity in the present tense, a gauge being defined as a passive device that exists only to measure something. The key to the Market Profile lies in correctly reading this information.
The statistical bell curve is employed to allow us to visualize what a graph might look like that plots time, a constant, on the horizontal axis against price, a variable, on the vertical axis. Scientists have employed this method of analysis for generations. Its utilization in market analysis creates a distribution curve that allows us to organize the data and better understand the continuous two-way auction process. The graph of the Market Profile is seldom bell shaped; there is, more often, a skew to the Profile. However, this fact does not detract from its value as a teaching tool to understand the foundational principle of the Market Profile.
Laying the Foundation
In this section, we will discuss the definitions and concepts that form the foundation for learning to understand the market through the Market Profile. As has been stated before, this is a challenging task. Everything you learn about the Market Profile is interrelated and integral to a complete understanding of the market. Each concept is like a piece in an intricate puzzle that should be studied to determine its place in the developing picture. If you file each piece away as a separately defined definition, you will be left with a jumble of seemingly unrelated facts. But, if you continually integrate each section of the book with what you have already learned, the picture will slowly emerge.
The Auction
Jim Kelvin intuitively knew that the bull trend in the yen was over because of his days in the ranching business. At first glance, the futures market seems to have very little to do with cattle ranching. However, they are both markets, and all markets share a common auction process through which trade is conducted.
As Jim Kelvin sat before his quote monitor on that morning, he recalled one of the last days he took his livestock to auction. Price for feeder cattle had been steadily climbing for several months, reaching a high of 86 cents, but the number of steers sold had fallen significantly during the previous week’s auction. The meat processers had cut back their purchasing to the bare minimum at higher prices, buying just enough to keep their processing plants operating and to meet their contract obligations. Jim knew that price would have to auction lower to find renewed buying.
A steer was led into the auction barn. The sale barn manager at one end of the circular corral called out the starting price, “Do I hear 80 cents for this fine feeder steer?” The opening call was too high and did not get a raise from the men standing around the perimeter of the circle. “78? . . . 76? . . . Do I hear 74 cents?” Finally, a buyer entered the auction, starting the bidding at 72 cents. After a small rally as buyers called out their offers, the steer was sold at 76 cents a pound. The up auction over the last few months in the cattle market had ended. Price had to auction lower to attract buyers. During some auctions there would be an immediate response to the opening bid, and price would move up quickly. “Do I hear 82? I have an offer for 82 . . . Do I hear 84? . . . 85?” as the men around the perimeter of the ring cried out their offers.
Other times, the initial price would be too high, and the auctioneer would quickly lower the bid, “Do I hear 78? . . . 77? . . . 76 for this fine steer?” The price would back off until a buyer entered the auction, then price would begin to move upward, often auctioning beyond the opening price. Once the auction got started, competition and anxiety among buyers sometimes drove the market beyond the prices that were initially rejected as too high. Price would continue up until only one buyer remained. “Ninety-two going once, twice, three times . . . sold,” then the auction was over.
The futures market auctions in a similar manner. If the open is considered below value, price auctions higher in search of sellers. If the open is considered too high by the market’s participants, price auctions lower, searching for buyers. Once a buyer enters the market, price begins to auction upward until the last buyer has bought. Similarly, the market auctions downward until the last seller has sold, constantly searching for information.
As you progress through this book, the importance of the market’s auction process will become evident. And, with the aid of the Market Profile, you will soon see that the futures market’s auction process is by no means a random walk.
Organizing the Day
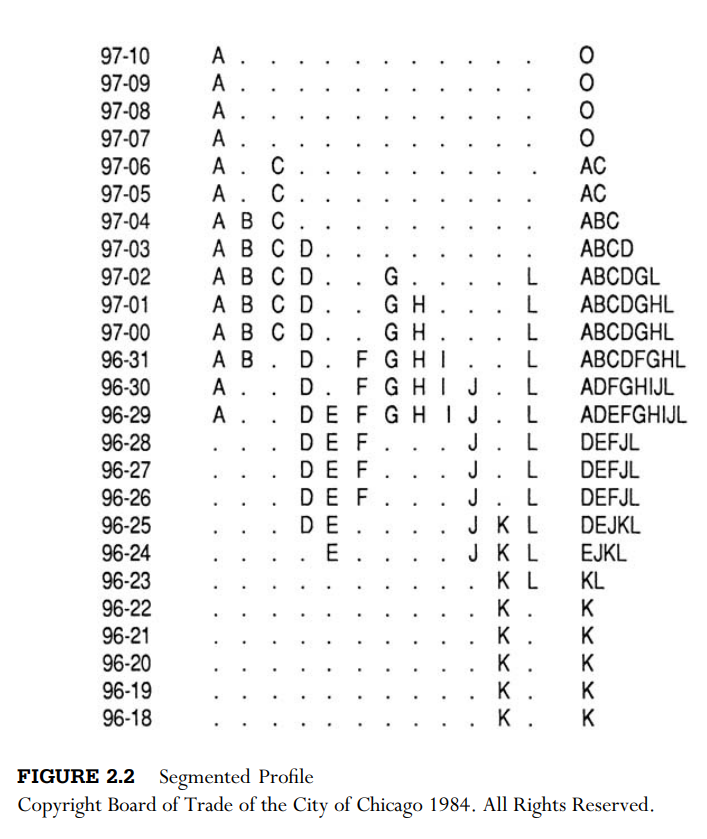
The basic building blocks of the Market Profile are called Time Price Opportunities, or TPOs. Each half hour of the trading day is designated by a letter. If a certain price is traded during a given half hour, the corresponding letter, or TPO, is marked next to the price. Figure 2.2 shows each half-hour segment separately alongside the completed profile. On a side note, Treasury bonds trade in 32nds of $1,000, and one tick is worth $31.25 ($1,000 divided by 32). In the bond market on this day, the prices traded during the first 30 minutes (A period) ranged from 96 29/32 to 97 10/32. The next time period (B period) traded from 96 31/32 to 974 /32, and so on. The resulting Profile is shown in Figure 2.2.
We will now proceed through the same day in the bonds step-by-step, explaining in detail how to read the basic information generated by the market through the Market Profile “gauge.” The numbers in the following discussion refer to Figure 2.3.
1. The price range resulting from market activity during the first two time periods (the first hour) for most commodities is called the initial balance
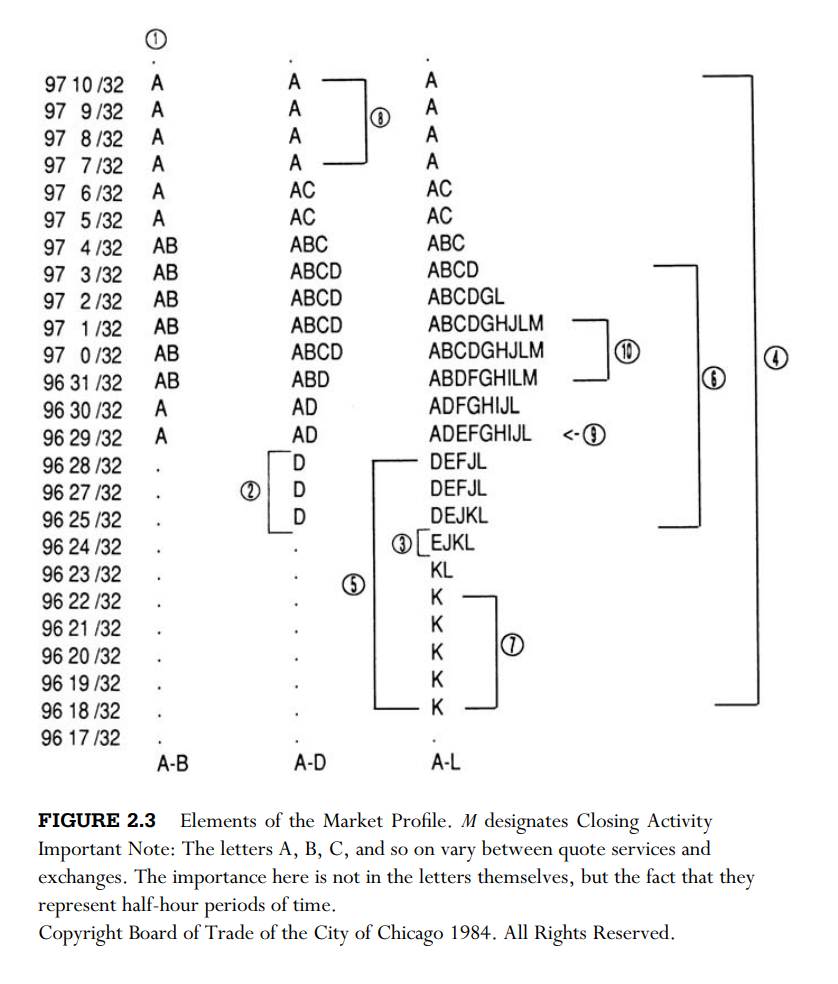
(slightly longer in the S&P). In the Treasury bond example shown in Figure 2.3, the initial balance was established from 96 29/32 to 97 10/32 by the floor traders, or locals, during A and B periods. The initial balance represents the period of time in which the locals attempt to find a range where two-sided trade can take place—a range where both the buyer and seller agree to conduct trade. Locals trade mostly in the day timeframe and provide liquidity, not direction, in the market by acting as middlemen between the off-floor traders. Their purpose is not to make one or two big trades every day, but to make a few ticks on a large volume of trades. The local is typically responsible for over 50 percent of the day’s trading volume.
The local’s role is like a car dealer—a middleman between the producer and consumer. The dealer’s goal is to move his inventory quickly to make a small profit on each sale. He must buy from the producer, like General Motors, at a price he finds fair, then turn around and sell to the consumer at a price that will attract buying while maintaining a degree of profit. The local on the floor of the exchange acts in the same way, buying from long-term sellers and selling to long-term buyers, who only enter the market when they feel price is away from value. We will refer to the long-term market participants as the “other” timeframe, for long term is a highly subjective concept and can represent a trade that spans anywhere from several days (sometimes called a swing trade) to several months. “Other” separates the traders whose participation spans more than one day from the locals, who operate solely in the shortest timeframe. The importance of the other timeframe participants will be discussed at greater length throughout the book, for it is the other timeframe activity that moves and shapes the market, just as General Motors and the consumer shape the automotive market. Understanding what the other timeframe is doing is vital in successfully trading the futures market.
2. In D period, the other timeframe seller enters the market and extends the range down to 9625/32. Any movement in price beyond the initial balance set up by the local in the first hour of trading is called range extension, and signifies that something has changed because of other timeframe buyer or seller presence.
The local is not responsible for any major moves in the market. It is the other timeframe that can move the price substantially.
Again, in D period, it is evident that the other timeframe seller entered the market and extended the range on the down side. Either the other timeframe buyer will respond to these lower prices, or the other timeframe seller will continue to auction price lower in search of buyers.
3. The responsive buyer did enter the market around 96 24/32, and price balanced around the lower portion of the day’s range until K period. An hour before the market’s close, the other timeframe seller probed 13NOVICE downward once again beginning with the K print at 96 25/32 and extending down to 96 17/32, but was met by the buyer responding to lower prices, forcing price back to close in the middle of the range.
4. The range refers to the entire height of the Profile—from the high to the low. On this day range was 96 17/32 to 97 10/32.
5. All activity below the initial balance is other timeframe seller range extension (just as all activity above the initial balance is other timeframe buyer range extension). Any activity above 97 10/32 or below 96 29/32 is range extension on this day.
6. The area where 70 percent of the day’s business is conducted (roughly one standard deviation) is called the value area. This is logical, for the middle part of the bell curve is where most activity occurs and indicates two-sided trade took place in the day timeframe. Similarly, in a teacher’s grading curve, most students score in the middle ranges, which is reflected in the wider middle area of the bell curve. If both buyer and seller are actively participating in an area, then that area is accepted as value by both parties. On July 25 in the bonds, value was accepted between 9624/32 and 973 /32. The value area can be easily calculated using TPOs or actual price/volume figures. A sample calculation of the value area is shown in Appendix 1.
7. The single K TPOs at the lower extreme of the Profile are called a single-print buying tail. This is an important reference point, for it indicates that the other timeframe buyer responded strongly to price advertised below value, rejecting price out of the lower range in one time period (K). Competition among buyers for contracts causes price to move quickly. Therefore, the longer the tail, the stronger the other timeframe activity. A tail occurring during the last period of the day is not technically a tail, for it cannot be validated by rejection in subsequent time periods. In addition, a tail must be at least two TPOs long to have any real significance.
8. The four single A prints at the top of the day’s range are a single-print selling tail. This tail shares the same significance as the other timeframe buying tail in K period. The other timeframe seller reacted to higher prices, quickly moving price lower. Attempts to auction beyond the single-print tail by trading up into that price range in subsequent time periods (C and D) met strong resistance, showing seller strength at those prices.
9. The longest line of TPOs closest to the center of the range is called the point of control. This is the price where the most activity occurred during the day, and it is therefore the fairest price in the day timeframe. The greatest amount of time was spent trading at that price, signifying greatest value. This concept will be further developed later, for it is of great importance in monitoring other timeframe activity in the day timeframe.
10. M period denotes the closing range, which is the market’s last indication of overall sentiment for the day. It is used as a reference point against the following day’s open to see if the underlying market sentiment has changed.
Challenging the Rules
You should now have a feel for reading the basic indicators of the Market Profile. Many concepts were introduced, some undoubtedly foreign to the opinions you were taught and the rules you learned about the futures market. Roger von Oech, author of A Whack on the Side of the Head, challenges the power of the rules.
. . . there is a lot of pressure in our culture to follow the rules. This value is one of the first things we learn as children. We are told, “Don’t color out-side the lines,” and “No orange elephants.” Our educational system encourages further rule-following. Students are usually better rewarded for regurgitating information than for playing with ideas and thinking of original uses for things. As a consequence, people feel more comfortable following rules than challenging them. Challenging the rules is a good creative thinking strategy, but that’s not all. Never challenging the rules brings with it . . . potential dangers.
Understanding the Market Profile requires more than the regurgitation of a list of concepts; it requires the ability to challenge the rules and look beyond the restricting confines of popular opinion. Look over the basics we just covered again. David had to know the basics of the music score before he could successfully play “Amazing Grace.”
The Role of the Marketplace
Consider the purpose of the market for a moment. Most traders don’t take the time to understand the very foundation of the market they are trying to master. The carpenter could not build a functional birdhouse if he never stopped to ask himself “Just what is the purpose of a birdhouse?” The reason for this basic oversight is directly related to von Oech’s challenge of the rules. Most people do not want to know the purpose of the market. They do not want to have to think rationally and objectively about the bigger picture. Most market participants, in fact most people in general, would rather be given a set of rules to blindly follow than to have to use personal insight and innovative thought. Again, the majority of the people who trade futures do not make money.
The purpose of the futures market is similar to any other market. It exists solely to facilitate trade, and it does so by auctioning from high to low and low to high, in order to find an area where trade can best be facilitated. Think of trade facilitation in terms of your corner grocery store. If the price of peanut butter is too high, shoppers will refrain from buying, and the grocer will realize that price is too high. He will then move price lower until the buyer responds by purchasing the product. If the grocer moves price too low, however, his inventory will be quickly depleted as buyers take advantage of price below value. Finally, the price will balance somewhere in between the two extremes, where value is established and two-sided trade can take place. Price must move too high or too low before both the grocer and the shopper know it has gone far enough. The same is true in the futures market. The market auctions up until the buyer will buy no more, and down until the seller will sell no more, in the process establishing extremes of price, shown in the profile as the tapering ends of the bell curve.
Now imagine that Figure 2.3 is a profile of the grocer’s peanut butter sales over the period of several months, instead of Treasury bond sales (in theory, not actual price and individual TPOs). Initially, the price was set too high, and there were no buyers to generate sales. The grocer then quickly lowered the price to move his inventory, as shown in the A period single print selling tail (see point 1 in Figure 2.3). Prices went too low in that same period and buyers bought heavily, allowing the grocer to move prices back up in B and C periods. The extremes of price seemed to have been established in A period, and value was accepted somewhere in the middle. In D period, however, another seller entered the market, a supermarket chain two blocks away.
The larger store could afford to charge lower prices, so the local grocer had to cut costs to stay in business. In the following weeks, value was established near the bottom of the previous lower extreme—value was accepted lower because of stronger sellers. Finally, the local grocer decided to do a promotional “peanut butter extravaganza” and substantially lowered price to attract shoppers. The ploy worked, as shown by the strong buying tail in K period. The buyers responded to lower prices, allowing the grocer to raise them to a profitable level once again.
This comparison is intended to bring home the similarity of the trade facilitation process in all markets. The futures market is a constant auction looking for a balance between the two major forces behind market movement: the other timeframe buyer and seller.
Let us look at the role of the other timeframe within the marketplace from another perspective for a moment. Looking at something in a different light often brings valuable insight. If Gutenberg had never looked at a wine press as something entirely different, we might not have the printing press today and you would be reading a manual handwritten by a scrivener (and paid a lot more for it). Imagine the other timeframe seller and the other timeframe buyer as two distinct personalities, two separate entities who stand on opposite sides of a game board in the shape of an exchange pit. They both have their fingers on big buttons; one says “sell” and the other “buy.” In the pit are miniature locals, yelling and gesturing as they do their trades. Other timeframe participants are battling for market control, and they enter the market when they feel price has gotten away from value or some external information convinces them to act. For example, a significant news event might cause the other timeframe buyer to enter the market and drive price upward for the entire day.
This example is obviously only an imaginative idea, but the other timeframe participants often do act as if they were individuals, and it is not always possible to tell why they enter the market. The point is, to successfully trade the futures market, you must understand what the other timeframe is doing and position yourself with them.
Going with the Crowd
In a classic Candid Camera TV show, a man waits for an elevator. When it arrives, everyone on it is facing the back of the elevator, so he gets on and faces backward also. If you blindly follow the majority, you will usually be going the wrong way. As we said before, the majority of market participants do not make money.
This is a pretty bold statement, but if you stop and think about how many times the big name analysts have been plain wrong, it doesn’t seem so far-fetched. Nonetheless, when the big movers on the Street talk, most everybody listens—it is much easier to dogmatically rely on an expert than to be a rugged individualist who makes his own decisions. When you rely solely on yourself, you alone take pride in reaping the rewards of success—but there is also no one else to blame for defeat. The tendency to be a follower is not an easy thing to realize or admit. Not surprisingly, one of the primary reasons many traders use a technical (mechanical) trading system is to take themselves out of the decision making process.
These are but a few thoughts to keep in the back of your mind as we continue through the Novice stage and discuss more labels and terms. Again, the Market Profile is not a technical or mechanical system, and the discussion to follow should not be memorised for later “regurgitation.” Remember, everything is a part of the larger whole, and “a little information is a dangerous thing.”
Organizing the day began with a discussion of initial balance; initial balance represented the period of time where local traders (i.e., floor traders) searched for a range where two-sided trade would take place. Locals traded mostly in the day timeframe and provided liquidity. Floor trader daily volume often averaged over 50 percent of day timeframe activity; the floor trader attempted to get in-between every trade; they attempted to buy from the seller and sell to the buyer. The importance of floors has continually diminished as off-floor, electronic, screen-based trading has evolved.
When floors were more of an integral part of trading I looked at the base that developed during the initial balance for early guidance; the broader the base the more stable the market was likely to be.
Electronic trading has provided far more transparency for traders; traders can now view volume at every price. Off-floor traders still attempt to make markets, which increases liquidity.
Another improvement is the faster dissemination of news; when floors were more dominant and news was slower to reach non-floor traders the locals had another advantage.
Initial balance today is slightly more ambiguous; however, it still represents early morning market activity.
Introduction to Day Timeframe Structure
When the local grocer priced his peanut butter below value in the “peanut butter extravaganza,” the consumer bought in a frenzy, leaving in its wake a single-print buying tail. Tails are an important piece of information in the anatomy of a Market Profile, for they indicate the presence of the other timeframe buyer or seller. A tail is an identifiable characteristic with definite implications. Whenever you see that particular pattern, you associate it with a specific set of facts, just as a linebacker learns, through experience, that certain formations indicate what the offense is going to do. On a bigger scale, the Market Profile as a whole tends to fall into readable patterns in the day timeframe, determined by the degree of involvement of the other timeframe participant. These patterns, when properly identified, can increase the day trader’s success, as well as provide information regarding what the market is trying to do in the longer term.
The labels we will give these patterns are not as important as understanding how the day evolves in relation to the initial balance and the confidence with which the other timeframe has entered the market. Think of the initial balance as a base for the day’s trading. The purpose of a base is to provide support for something, as the base of a lamp keeps the lamp from tipping over. The narrower the base, the easier it is to knock the lamp over. The same principle holds true for futures trading in the day timeframe. If the initial balance is narrow, the odds are greater that the base will be upset and range extension will occur. Days that establish a wider base provide more support and the initial balance is more likely to maintain the extremes for the day.
If you think of the other timeframe as a single personality, as in the game board analogy, it is possible to judge the activity of all the other timeframe buyers or sellers according to their level of “confidence.” Each day type is the result of varying degrees and forms of other timeframe activity, and this activity tends to fall into certain patterns. Keep these broader concepts of base and confidence in mind as we examine the six day types.
Normal Day
Dynamics
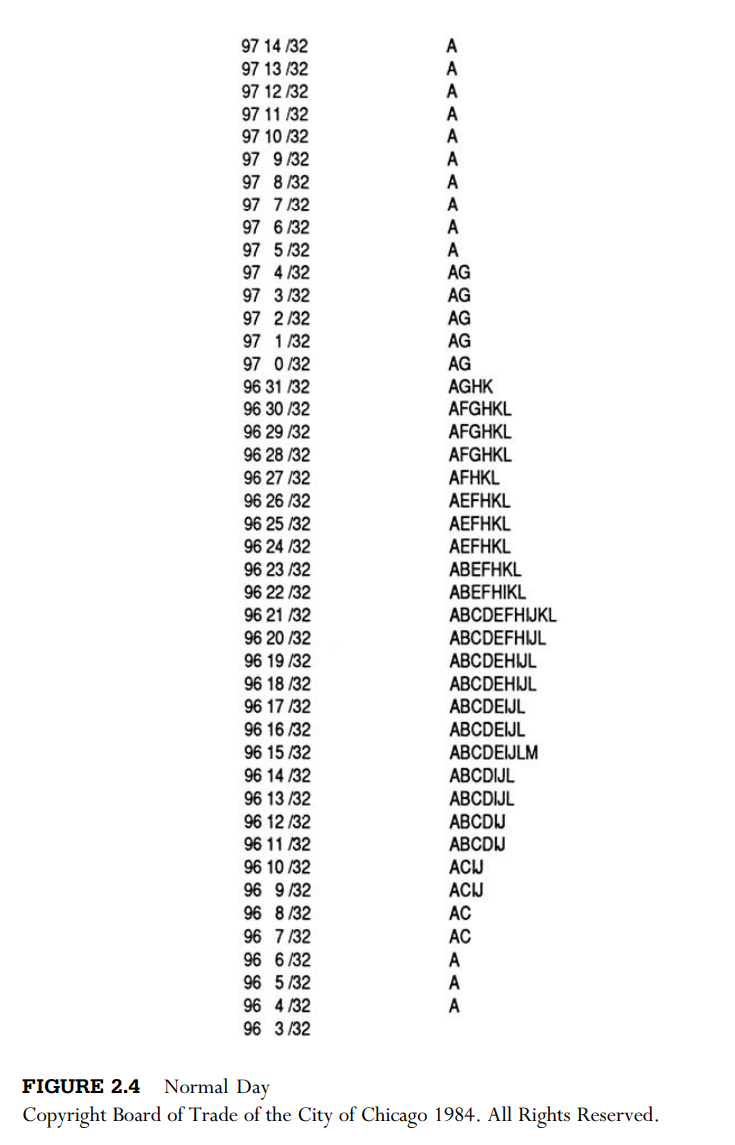
The label“Normal day”is misleading,for in reality,“Normal” days are more the exception than the rule. Normal days are generally created by swift early entry of the other timeframe participant, which has the effect of establishing a wide initial balance. Thereafter, both the other timeframe buyer and seller auction price back and forth between them, as balanced, two-sided trade ensues.
Normal days are often caused by a news announcement early in the trading session that triggers a strong other timeframe reaction, driving price
quickly in one direction. For example, suppose that a bearish economic indicator released shortly after the open causes the other timeframe seller to aggressively enter the market and drive price lower. Eventually, price moves low enough to attract other timeframe buying, thus cutting off the selling activity. For the remainder of the day, there is little strong directional conviction and price balances between the extremes. An example of a Normal day is shown in Figure 2.4.
Structural Characteristics
The primary characteristic of a Normal day is the wide initial balance, or base, that is not upset throughout the day. In Treasury bonds in Figure 2.4, the initial balance was established in A and B periods from 964 /32 to 9714/32—well over a point wide. Other timeframe sellers entered on the upper extreme because price auctioned too high, creating a strong single print selling tail, while other timeframe buyers entered on the lower extreme as price auctioned too low, creating a single-print buying tail. Price spent the rest of the day auctioning within the extremes.
On the surface, Normal days might appear easy to trade. However, imagine the anxiety in placing an order to buy just after the price has dropped over a point! The bottom appears to be literally dropping out of the market, and you have to pick up that phone and say “buy it.” This is not to say that every time a market drops a point you should step up and buy—that would be financial suicide. But as we proceed through the more common day types and you observe them through your own experience, you will begin to develop an understanding of which day timeframe patterns and logical market situations will give you the confidence to buy against such a break. We bring this up primarily to touch on two key principles that you will no doubt grow tired of by the end of this book. They are: The best trades often fly in the face of the most recent market activity, and never lose sight of the bigger picture.
Normal Variation of a Normal Day
Dynamics
A Normal Variation of a Normal day is characterised by market activity early in the trading session that is less dynamic than that of a Normal day. As the day progresses, however, the other timeframe enters the market and substantially extends the range. It is as if the other timeframe participant had watched the auctions for a while, then decided price was opportune and entered aggressively. The other timeframe’s conviction is more evident, due to range extension on this type of day (compared to a Normal day). In Figure 2.5, the other timeframe seller auctioned price downward in D period until the other timeframe buyer responded to lower prices and cut off the selling. For the remainder of the day, trade is two-sided and a new area of balance is established.
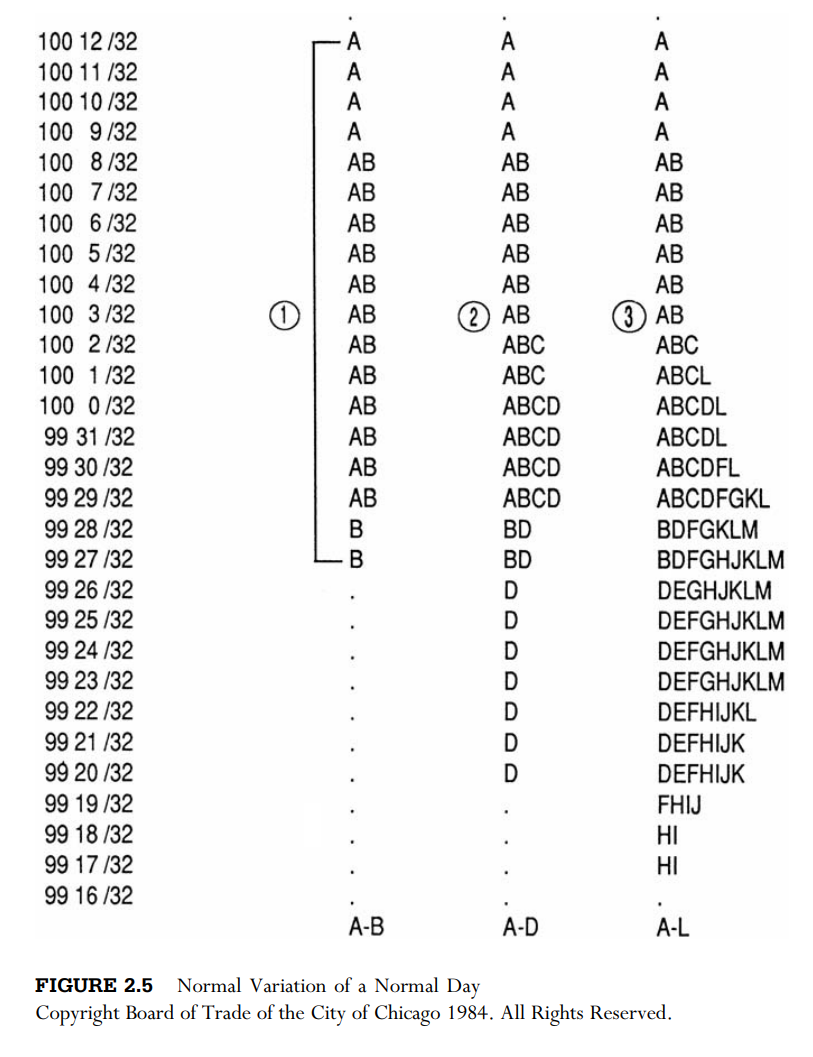
Normal Variations typically do not have quite as wide of an initial balance as Normal days (point 1 in Figure 2.5). The initial balance, or base, is upset on one side by other timeframe range extension, usually early in the day. In Figure 2.5, the other timeframe seller extended the range down in D period, “tipping over” the base to the downside (point 2). For the duration of the day, the market’s auction process involves the other timeframe buyer, other timeframe seller, and the local (referred to as two-timeframe trade). On this day, selling range extension causes value to be established lower (point 3).
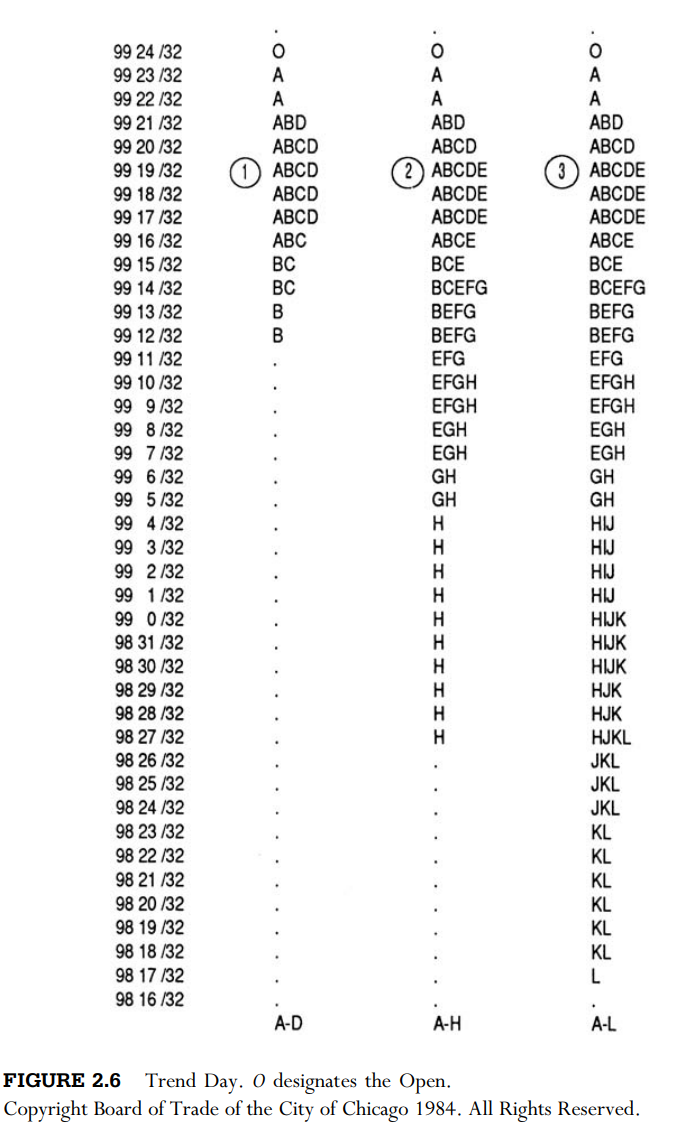
Trend Day
Dynamics
There are two types of Trend days: the standard Trend day and the DoubleDistribution Trend day. The most important feature of a standard Trend day is the high level of directional confidence that is evident throughout the day. The other timeframe buyer or seller remains in control of the auction process virtually from the day’s open to its close. In addition, as a Trend auctions higher or lower, it continues to draw new business into the market, thus creating unidirectional, sustained price movement fueled by higher volume.
Structural Characteristics
On a Trend day, the open forms the upper or lower extreme in the large majority of cases (point 1 in Figure 2.6), because the other timeframe is usually in control from the opening bell. In the Trend day example in Figure 2.6, the other timeframe seller extends the range downward during multiple time periods, remaining in control for the entire day (points 2 and 3). Such unidirectional activity is referred to as a “one-timeframe” market. During a one-timeframe buying Trend day, each time period will auction to a higher (or equal) price level without auctioning below the previous time period’s lows. Conversely, in a one-timeframe selling Trend day, each additional time period will equal or extend below previous periods without auctioning above the previous period’s highs. For example, in Figure 2.6, E period extended below D on the downside, thus extending the range to begin the trend day. Then G auctioned lower than E (without auctioning above the E period high), H lower than G, J lower than L, and so on.
One-timeframe conditions are a good indication of other timeframe control and a potential Trend day. A Trend day differs from a Normal Variation day in that the Trend day’s Profile is generally thinner and more elongated, usually no more than four or five TPOs wide at any point. Failure to recognize and accept that one is in a Trend day is one of the most costly mistakes a trader can make. Several days of trading profits can be lost in one trading session if you are positioned against the trend. It is important to identify early that either the other timeframe buyer or seller is in clear control and position yourself with them.
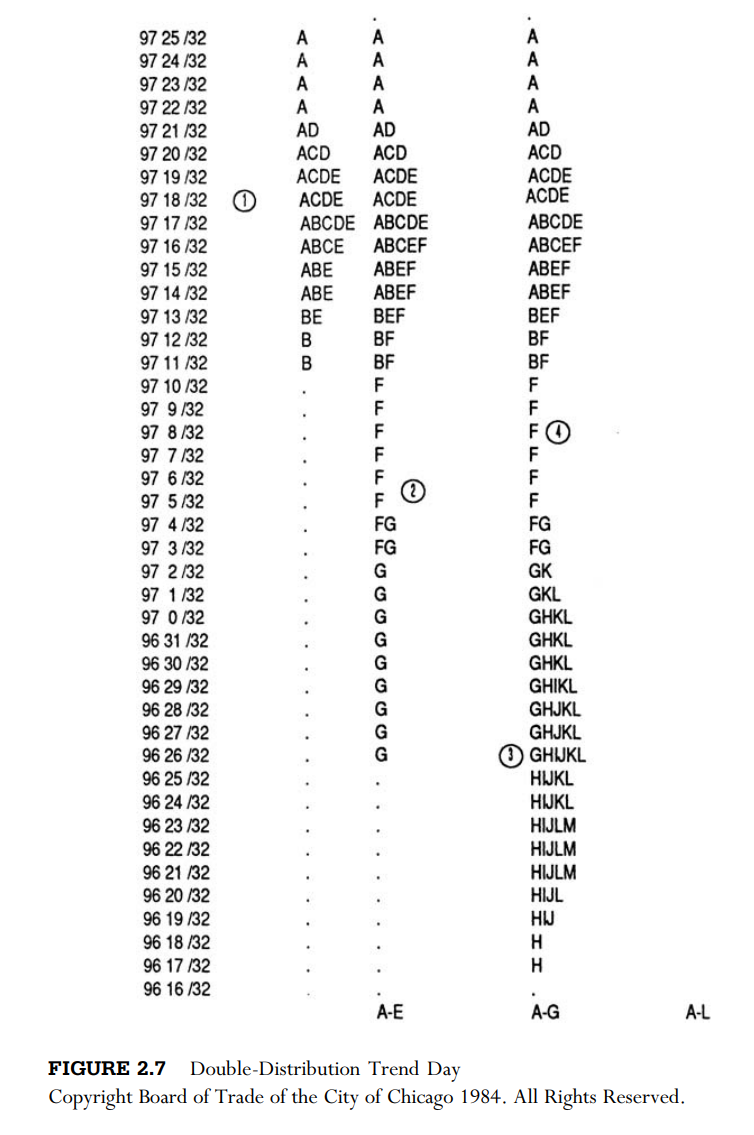
Double-Distribution Trend Day
Dynamics
The second type of Trend day, the Double-Distribution Trend day, is relatively inactive during the first few hours of the trading session. Market participants possess a low level of conviction, resulting in a narrow base. Later in the session, a change in events causes the other timeframe to perceive price to be unfair at current price levels, enter the market aggressively, and substantially extend the range. This later entry by the other timeframe drives price to a new level, where a second balance region develops. The Double-Distribution Trend day does not possess the steady confidence of a typical Trend day and must stop and reassure itself after a substantial move.
Structural Characteristics
A very small initial balance is the first indication of a potential DoubleDistribution Trend day. Again, the more narrow the base, the easier it is to overwhelm this area and auction quickly to a new level (point 1 in Figure 2.7). In Figure 2.7, the other timeframe seller extends the range down in F and G periods (point 2). Lower prices are accepted as value forms below the original value area in a new distribution, separated by single TPO price prints (point 3). This new trading range generally holds throughout the day, often providing useful reference points and good trading opportunities for day traders.
The single prints separating the two distributions in a DoubleDistribution Trend day become an important reference point near the end of the day. If price auctions back into the single prints during the latter time periods, in effect making them double prints, something has changed, and the second distribution is no longer accepted as value. For example, in the Double-Distribution Trend in Figure 2.7, a price probe into the F period single prints (point 4) would indicate that a strong other timeframe buyer had entered, or that the other timeframe seller conviction that caused the initial range extension is no longer present.
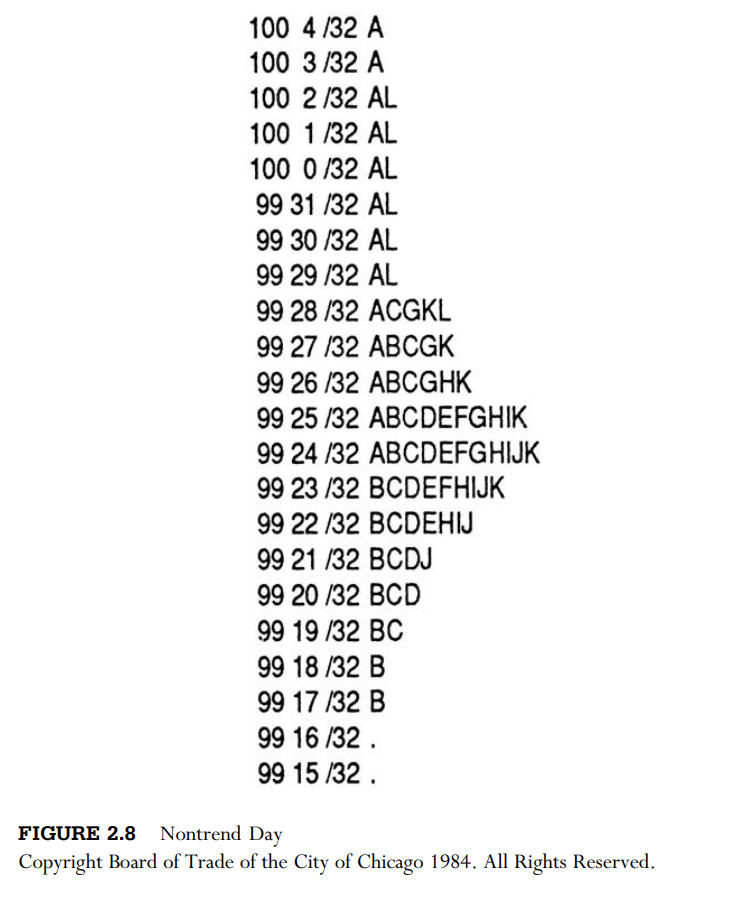
Nontrend Day
Dynamics
A Nontrend day is characterized by a complete lack of directional conviction. Nontrend days often occur before the release of a big economic number, a news event, or a holiday. Market participants balance their positions in expectation of the market’s reaction to the external stimuli— there is simply no activity. Trade is not being facilitated in any direction, for there is little market participation and no confidence.
Structural Characteristics
A Nontrend day starts out looking as if it might be a Trend day, for the initial range is narrow. However, the other timeframe never surfaces and there is no range extension. The market is waiting for new information before making its next directional move. A typical Nontrend day in Treasury bonds is shown in Figure 2.8.
Neutral Day
Dynamics
When a Neutral day occurs, it means that the other timeframe buyer and seller are not far apart in their view of value. When they have similar views of value, the market balances, auctioning back and forth between them. During a Neutral day, both other timeframe participants are present (if only one were active, there would be an imbalance and a Trend or Normal Variation type of day would occur).
It is important to keep in mind that while the other timeframe buyer and seller may be close in their perception of value, they rarely agree on the same price, just as the automobile producer rarely agrees with the long-term car buyers. Therefore, the other timeframe buyer and seller do not trade with each other, they trade with the local—the middleman.
Structural Characteristics
On a Neutral day, the base width is somewhere between a Trend and Normal day. It is not so small as to be easily upset and not wide enough to hold the day’s extremes (point 1 in Figure 2.9). The salient feature on a Neutral day is the fact that both the other timeframe buyer and the other timeframe seller are active, as is evidenced by range extension on both sides of the initial balance (points 2 and 3). This indicates a market in balance (point 4), for all timeframes are involved.
There are two types of Neutral days: Neutral-center and Neutral-extreme. On a Neutral-center day, the day closes with price in the middle of the range,
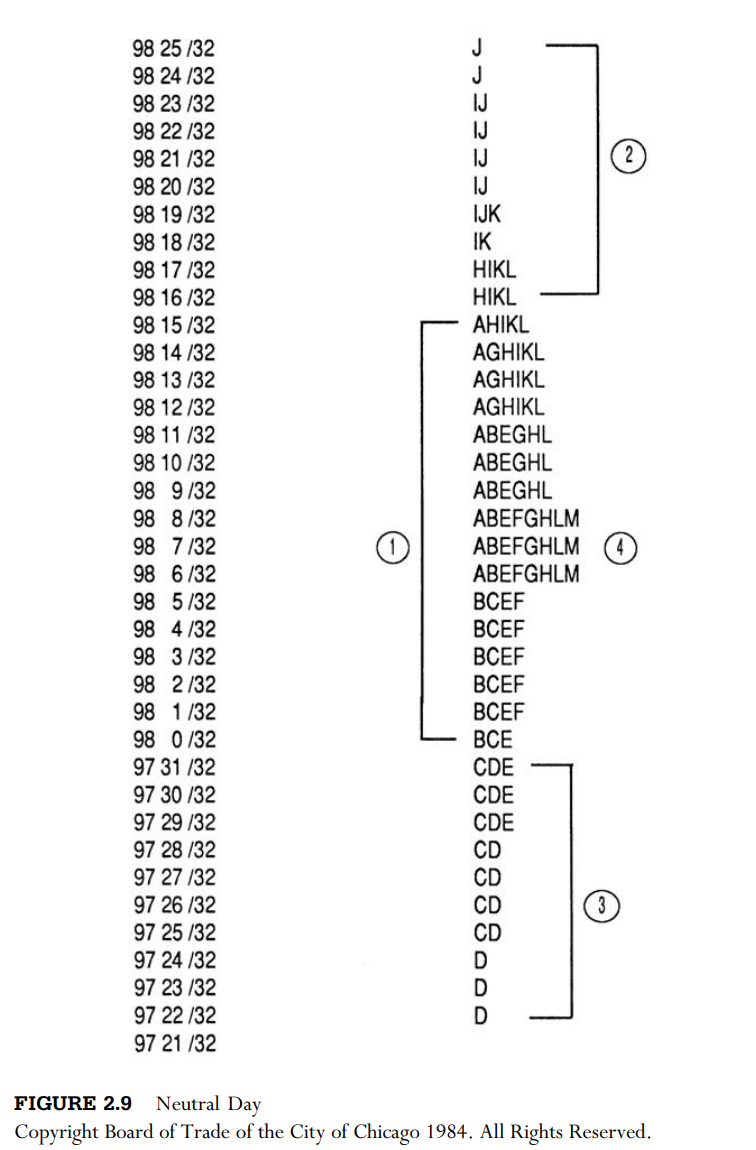
indicating a lack of confidence and a balance between the other timeframe buyer and seller. On a Neutral-extreme day, price closes on either the high or low extreme for the day, indicating a hypothetical “victory” in the day timeframe battle for control between the other timeframe buyer and seller.
If the day closes on the upper extreme on a Neutral day, then the other timeframe buyer has higher directional conviction. Conversely, if the close is on the lows, the other timeframe seller has exhibited greater confidence.
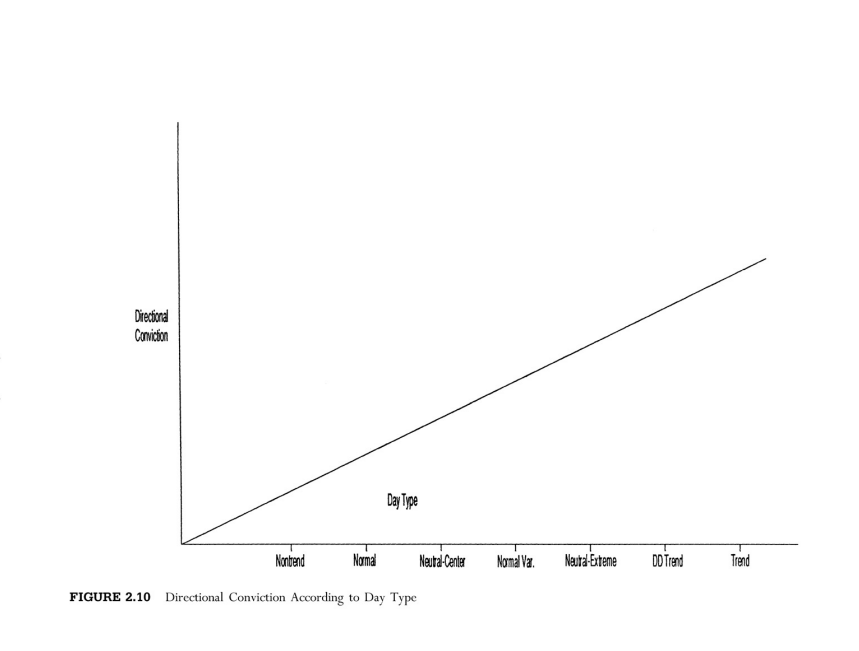
Day Type Summary
The chart in Figure 2.10 displays the type of day on the horizontal axis and the level of directional conviction that the day exhibits on the vertical axis. The result is a gradually ascending line from lowest conviction to highest, from a Nontrend day to a Trend day. Again, the labels we have given the day types are not carved in stone, but are used only for learning purposes. What should become clear is that by monitoring a day’s conviction very early in the trading session, traders can quickly begin to understand and visualize how the day will develop.
At this point you know the basic “objective facts and features” about the Market Profile. Like David the novice piano player, you have learned the foundation for further learning, but there is a long way to go. In the following sections, the concepts you have learned as a novice will serve as the foundation for understanding the market, like the staff and notes are the foundation for understanding music.
Remember to actively interpret and combine your new knowledge with your experience in the market. Do not put the facts you have learned as a novice away and say, “Okay, what’s next?” The learning process is an ongoing synthesis, each part fitting into the next like a puzzle. Trying to become an expert trader without a continuum between the stages is like trying to put together a puzzle with all the pieces the same color. Look for the big picture.
Mind Over Markets CHAPTER 3 - Advanced Beginner